To test whether Nutrigro natural hair loss products do work we put through an independent study…this is what we found...
OBJECTIVES
To measure any change in volume of individual hair fibres after a single application of Nutrigro Shampoo and Serum formulation.
SAMPLES
The samples comprised 10 lots of hair fibres from 10 different individuals. Shampoo and Nutrigro serum was also supplied. 10 hairs from five individuals were measured dry, washed and then treated with Nutrigro. The fibres were then re-measured and the volume change calculated.
METHODS
10 hairs were randomly selected from five different people. Three measurements were then made (approximately in the middle region of the hair), around 1 mm apart. The hairs were then washed and the serum applied. The fibres were left to dry overnight (ambient temperature) and then re-measured in (approximately) the same region in order to calculate any volume increase. Finally, an SEM micrograph of the same fibre with treated and untreated regions was imaged in order to show a visual comparison of the volume increase.
RESULTS Table 1
|
Selected Hair |
Change in volume measured after serum treatment |
||||
|
Volume (µm3)* |
|||||
|
Person 1 |
Person 2 |
Person 3 |
Person 4 |
Person 5 |
|
|
Hair 1 |
41274.36 |
-181506.72 |
-260073 |
474103.08 |
-1485455.97 |
|
Hair 2 |
-104662.03 |
-158401.32 |
1224015.32 |
-1735356.29 |
300534.05 |
|
Hair 3 |
599631.01 |
436712.52 |
-1114307.32 |
-235757.39 |
-38772.37 |
|
Hair 4 |
-141211.75 |
70541.1 |
-233460.81 |
20955.78 |
394342.58 |
|
Hair 5 |
-587268.86 |
946954.35 |
61416.19 |
1412724.22 |
115811.21 |
|
Hair 6 |
372004.25 |
-236556.4 |
-1269996.82 |
-26594.98 |
-1084836.27 |
|
Hair 7 |
-81723.33 |
-65205.52 |
-629507.87 |
588764.48 |
349553.01 |
|
Hair 8 |
-32584.56 |
-1970906.81 |
-366117.04 |
54483.56 |
445723.01 |
|
Hair 9 |
488658.66 |
-664187.52 |
-278165.59 |
716909.23 |
700152.15 |
|
Hair 10 |
-94204.89 |
-419420.03 |
1452110.85 |
-69212.01 |
1047050.01 |
|
% hairs that showed increase (%success) |
40% |
30% |
30% |
60% |
70% |
The change in volume of hair before and after treatment is shown above – each figure is the mean average of three areas on each hair. Where negative values exist, this was attributed to natural variation in the thickness of the hair fibres, i.e. because the exact same area was not measured on the hair ‘after’ treatment, it was likely that this region was naturally thinner than the area measured ‘before’ treatment, hence the apparent reduction.
Figure 1 below shows a specific untreated region (covered with tape when the serum was applied)
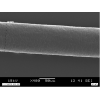
– the diameter measures approximately 65 microns. Figure 2 is an area of the same fibre that has been subjected to the Shampoo and Serum – the diameter is approximately 90 microns (25 microns thicker).
Figure 1: Region from an untreated region. Diameter ca. 65 microns
The treated region from the same hair. Diameter ca. 90 microns

The result is the diameter increases from about 65 to 90microns.
If you cannot see the SEM microscope picture email me at ravi@nutrigro.co.uk and I can email it to you.
Ravi Bhanot
For more information please email me ravi@nutrigro.co.uk
2 comments